
10 Best Mass Mailing Service Providers for Inbox Success
July 22, 2026
10 Best Email Relay Service Providers for Better Delivery
August 11, 2026Email Marketing Benchmarks: The Complete Guide for 2026
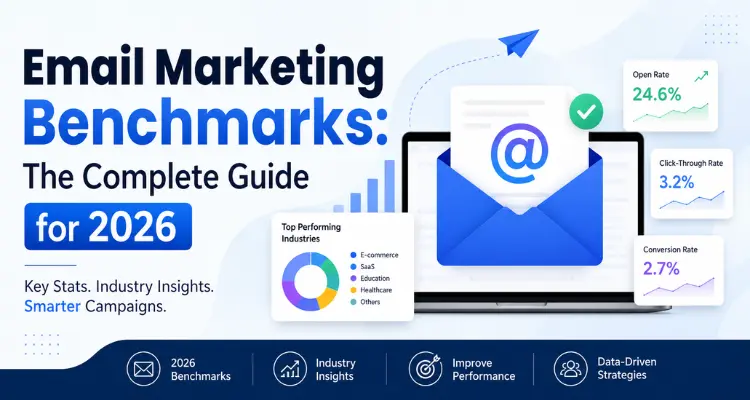
Email marketing benchmarks 2026 dashboard showing open rates, click-through rates, bounce rates, unsubscribe rates, and industry performance metrics
Have you ever sent out a campaign and wondered if your numbers were actually good? You are not alone. Almost every business owner and marketer asks the same question after hitting send.
This is where email marketing benchmarks come in handy. They give you a clear picture of what normal, strong, and weak performance looks like across different industries.
In this guide, we will walk through everything you need to know about email marketing benchmarks. We will cover the key metrics, the latest numbers by industry, common mistakes, and simple ways to improve your results. By the end, you will know exactly how to read your own data with confidence.
Table of Contents
What Are Email Marketing Benchmarks?
Email marketing benchmarks are standard performance metrics that help businesses evaluate the effectiveness of their email campaigns. They provide average rates for key metrics like opens, clicks, unsubscribes, and bounces, allowing marketers to compare their results against industry standards and identify opportunities for improvement.
- Measure campaign performance against industry averages.
- Include key metrics such as open rate, click-through rate, bounce rate, and unsubscribe rate.
- Help identify strengths and areas needing optimization.
- Provide realistic performance goals based on similar businesses or industries.
- Enable data-driven decisions instead of relying on assumptions.
- Support continuous improvement by tracking progress over time.
- Offer valuable context for evaluating the success of email marketing strategies.
Why Email Marketing Benchmarks Matter So Much
Email remains one of the most reliable ways to reach customers directly. Billions of emails get sent every single day, which means competition for attention is fierce.
Knowing where you stand against the competition helps in several ways:
- It shows you if your strategy is working or needs a fix.
- It helps you set realistic goals instead of guessing.
- It highlights weak spots in your campaigns early.
- It gives you talking points when reporting results to a boss or client.
- It helps you decide where to spend your time and budget.
Without benchmark data, you are basically flying blind. You might think your campaign failed when it actually performed close to the industry standard.
Key Email Marketing Metrics You Should Know
Before diving into the numbers, let’s quickly cover the metrics that matter most. These are the building blocks of every benchmark report.
Open Rate
This shows the percentage of people who opened your email out of everyone it was sent to. It is one of the oldest metrics in email marketing, though it has become less reliable in recent years.
For example: Apple Mail Privacy Protection now preloads images automatically for many users. This means an email can register as opened even if the person never actually looked at it. Because of this, smart marketers treat open rate as a rough indicator rather than a perfect measurement.
Click Rate (Click-Through Rate)
Click rate measures the percentage of recipients who clicked a link inside your email. This email metric is far more trustworthy than open rate because a click requires real action from the reader.
If someone clicks, they actually engaged with your content. This makes click rate one of the most important numbers to track when reviewing email marketing benchmarks.
Click-to-Open Rate (CTOR)
This metric only looks at people who already opened the email. It then calculates what percentage of those openers went on to click something.
CTOR tells you how persuasive your actual content is. A high CTOR means your subject line attracted the right people and your message convinced them to act.
Unsubscribe Rate
This shows how many people chose to leave your list after receiving a campaign. A rising unsubscribe rate is often an early warning sign.
It can point to problems like sending too often, irrelevant content, or mismatched expectations from your sign-up process.
Bounce Rate
Bounce rate tracks emails that failed to reach the inbox. There are two types:
- Soft bounces: Temporary issues like a full inbox or a server problem.
- Hard bounces: Permanent issues like an invalid or closed email address.
Keeping your bounce rate low protects your email sender reputation and keeps your emails landing in inboxes instead of spam folders.
Latest Email Marketing Benchmarks: Key Statistics and Insights
Now let’s get into the numbers everyone wants to see. These figures come from large scale industry studies covering millions of campaigns.
Overall Average Performance
Across most industries, here is what current data shows:
- Average open rate: typically falls between 19% and 43%, depending on the data source and how Apple Mail Privacy Protection is factored in.
- Average click rate: around 2.0% to 2.5% across most sectors.
- Average click-to-open rate: roughly 5% to 7%.
- Average unsubscribe rate: close to 0.2% to 0.9%.
- Average bounce rate: usually between 1% and 2.5%.
These overall numbers act as a starting point. The real value comes from looking at the best email marketing benchmarks broken down by specific industry, since performance can shift quite a bit depending on your sector.
Top Performing Industries by Open Rate
Some industries consistently see higher engagement than others. Based on recent large scale reports, the strongest performers tend to include:
- Religious organizations: often the highest open rates of any sector, sometimes above 55%.
- Hobbies and leisure: audiences are passionate, which drives strong opens.
- Non-profit organizations: subscribers usually opt in because they care deeply about the cause.
- Government and public sector: people often expect important updates and open accordingly.
- Education: institutional emails tend to get opened more reliably.
On the other end, travel, e-commerce, and retail tend to land near the bottom for open rates. This usually happens because these industries send frequent promotional content, which can lead to inbox fatigue over time.
Click Rate and CTOR by Industry
When you look at benchmark email marketing data for click rates, some clear patterns appear:
- Legal services often lead with some of the highest click rates, sometimes close to 5%.
- Manufacturing tends to perform strongly on click-to-open rate.
- Government and nonprofit sectors also perform well above average on clicks, since their content feels relevant and timely.
- Retail and e-commerce generally sit below average, often because of heavy promotional volume.
A useful way to think about this: B2B and mission-driven sectors usually win on opens and clicks because their audiences are more invested. Retail and e-commerce often need extra personalization to compete in a crowded inbox.
Email Marketing Industry Benchmarks for Ecommerce Specifically
If you run an online store, here are a few extra data points worth knowing:
- Flow-based emails, like abandoned cart or welcome series messages, regularly outperform regular campaigns. Some reports show flow emails getting three times higher click rates than standard campaigns.
- AI-powered product recommendations have been shown to lift click rates noticeably compared to generic promotional emails.
- Top performing ecommerce brands can double the average open rate, click rate, and order rate compared to typical accounts.
This shows that automation and personalization make a real difference, especially in competitive sectors like retail.
Why Choose DigitalAka™ for Smarter Email Marketing Success?
Understanding email marketing benchmarks is easier when you have the right insights and tools. DigitalAka™ helps businesses, marketers, and growing brands track important email marketing metrics and make informed decisions based on real performance data.
How DigitalAka™ Helps
DigitalAka™ supports businesses by helping them in email marketing maintaining the email marketing benchmarks.
- Monitor campaign performance with clear and actionable reports.
- Compare key email marketing metrics against industry standards.
- Identify opportunities to improve engagement.
- Build stronger customer relationships through better email strategies.
- Track long-term growth and campaign effectiveness.
Key Features
With DigitalAka™, businesses can focus on the metrics that matter most:
- Email open rates
- Click-through rates
- Conversion rates
- Bounce rates
- Unsubscribe rates
- List growth rate
- Email deliverability
- Customer engagement trends
Benefits of Using DigitalAka™
When businesses understand email marketing benchmarks, they can:
- Create more effective email campaigns.
- Improve audience targeting through segmentation.
- Personalize content for different customer groups.
- Optimize send times for better engagement.
- Reduce spam complaints and bounce rates.
- Increase customer retention and loyalty.
- Make data-backed marketing decisions.
Practical Value for Different Businesses
DigitalAka™ can support:
- Small businesses looking to grow their audience.
- E-commerce brands aiming for higher sales.
- SaaS companies nurturing leads.
- Agencies managing multiple client campaigns.
- Content creators building subscriber communities.
- B2B organizations strengthen customer communication.
Best Practices Promoted by DigitalAka™
DigitalAka™ encourages businesses to:
- Clean email lists regularly.
- Track campaign performance consistently.
- Test different subject lines and content formats.
- Segment audiences based on interests and behavior.
- Use automation where it adds value.
- Review industry trends and performance data.
- Improve campaigns through continuous testing.
Why DigitalAka™ Matters
Businesses that pay attention to email marketing benchmarks are better equipped to:
- Understand what success looks like.
- Spot performance gaps early.
- Improve return on marketing investment.
- Build trust with subscribers.
- Deliver more relevant and engaging email experiences.
DigitalAka™ combines practical insights, performance tracking, and proven email marketing practices to help businesses create stronger campaigns and achieve steady, measurable growth.
Important Factors That Influence Email Marketing Benchmarks
Several factors shape why your numbers might look different from the overall average. Understanding these factors helps you interpret your own results correctly.
- Audience Type: Some audiences check email constantly and expect frequent updates. Others prefer occasional contact. A tightly engaged list will almost always outperform a broad, cold list.
- Send Frequency: Sending too often can wear out your audience and lower open rates over time. Sending too rarely might mean people forget who you are. Finding the right balance matters more than chasing a specific number.
- List Quality: A clean, well-maintained list leads to better deliverability and stronger engagement. Old, inactive, or purchased lists almost always drag down your performance and increase bounce rates.
- Content Relevance: Educational content tends to perform well in professional and B2B settings. Promotional content tends to perform better in retail and consumer focused brands. Matching your content style to your audience expectations is key.
- Industry Type: As we covered above, certain sectors naturally see higher engagement due to audience passion or perceived importance of the message. This is exactly why email marketing benchmarks by industry exist instead of one single number for everyone.
Benefits of Using Email Marketing Benchmarks
Using reliable email marketing benchmarks gives your strategy real direction. Here are some of the biggest advantages:
- Realistic goal setting: You stop guessing and start setting targets based on actual industry data.
- Better budget decisions: You can justify spending more on tools or content when you can show measurable improvement against a benchmark.
- Early problem detection: A sudden drop compared to your usual benchmark often signals a technical or content issue before it becomes serious.
- Stronger reporting: Comparing your results to top email marketing benchmarks gives clients or managers helpful context, rather than just raw numbers.
- Competitive awareness: You get a sense of how your campaigns measure up against others in your space.
Common Challenges When Using Email Marketing Benchmarks
While benchmark data is useful, it does come with a few challenges worth understanding.
- Privacy Changes Skew Open Rates: Apple Mail Privacy Protection and similar tools have made open rate far less reliable than it used to be. Many marketers now lean more heavily on click rate and click-to-open rate instead.
- Benchmarks Vary by Source: Different platforms calculate and report numbers slightly differently. One report might show an 18% open rate average, while another shows 40%. This usually comes down to differences in methodology, audience size, and how privacy protections are accounted for.
- Industry Averages Hide Variation: An average number can hide a lot of detail. Within the same industry, a small local business and a large national brand might have very different audiences and results, even though both fall under the same benchmark email marketing category.
- Benchmarks Are a Starting Point, Not a Final Answer: It’s easy to obsess over hitting a specific number. But your own historical performance often matters more than an outside average. The goal should be steady improvement, not chasing someone else’s number.
Best Practices for Improving Your Email Marketing Performance
Here are practical, proven ways to lift your numbers and move closer to top email marketing benchmarks in your sector.
Clean Your List Regularly
- Remove inactive subscribers who haven’t opened anything in six months or longer.
- Use double opt-in to confirm genuine interest from new subscribers.
- Monitor bounce rates and remove invalid addresses quickly.
Write Better Subject Lines
- Keep subject lines short and clear.
- Avoid spammy words that might trigger filters.
- Test different versions to see what resonates with your audience.
Segment Your Audience
- Group subscribers by interest, purchase history, or engagement level.
- Send more targeted content instead of one generic blast to everyone.
- Use behavior triggers, like abandoned cart emails, to reach people at the right moment.
Optimize Send Times
- Tuesday and Wednesday often show stronger engagement across many industries.
- Avoid sending late at night or very early in the morning unless your data shows otherwise.
- Test send times with your own audience rather than copying generic advice exactly.
Personalize Your Content
- Use the recipient’s name when appropriate.
- Recommend products or content based on past behavior.
- Avoid sounding like a mass broadcast; aim for a one-to-one tone.
Focus on Mobile Design
- More than half of all emails get opened on mobile devices.
- Use a single column layout that adjusts well to smaller screens.
- Keep buttons large enough to tap easily.
- Test your emails on a few different phone screens before sending to your full list.
Test and Refine Your Sending Habits
- Try splitting your list to test two subject lines on the same campaign.
- Track which day of the week gets the strongest response from your specific audience.
- Adjust frequency based on engagement rather than sticking to a fixed schedule out of habit.
Common Mistakes to Avoid
Many businesses unintentionally hurt their own performance by not following the email marketing benchmarks while carrying out email marketing. Watch out for these common mistakes:
- Buying email lists: Purchased contacts almost always lead to high bounce rates and spam complaints.
- Sending too frequently: This often leads to higher unsubscribe rates and lower opens over time.
- Ignoring mobile users: A poor mobile experience can quietly kill your click rate.
- Focusing only on open rate: Since privacy changes have made this metric less reliable, relying on it alone gives an incomplete picture.
- Skipping segmentation: Sending the same message to your entire list usually performs worse than targeted campaigns.
- Forgetting to clean your list: An old, stale list drags down nearly every metric you care about.
Industry Trends Shaping Email Marketing Benchmarks
A few clear trends are shaping how marketers approach email today and are changing the Email Marketing benchmarks in today’s scenario.
- Automation Is Outperforming Manual Campaigns: Automated flows like welcome series, abandoned cart reminders, and post-purchase follow-ups consistently beat one-off campaigns. They reach people at the right moment, which naturally improves engagement.
- Click Metrics Are Replacing Open Rate as the Gold Standard: Because of privacy protections affecting open tracking, more marketers now prioritize click rate and click-to-open rate. These numbers better reflect genuine interest.
- Personalization Powered by Data Is Growing: Brands using purchase history, browsing behavior, and AI-driven recommendations are seeing noticeably stronger results than those sending generic promotional blasts.
- Mobile-First Design Is No Longer Optional: With more than half of all email opens happening on phones, mobile-friendly design has shifted from a nice extra to an absolute requirement.”
Final Thoughts
Email marketing benchmarks give you the context needed to understand whether your campaigns are truly succeeding or simply average. They turn confusing raw numbers into something you can actually act on.
Remember that these figures vary by industry, audience, and even region, so always compare yourself to the most relevant data available. Focus on steady, measurable progress rather than chasing a perfect score overnight.
Whether you’re a beginner just starting your first campaign or a seasoned marketer refining your strategy, understanding email marketing benchmarks will help you make smarter decisions, set realistic goals, and build stronger relationships with your audience through better, more relevant emails.
Frequently Asked Questions
A solid open rate generally falls between 20% and 30% for most industries, though this varies quite a bit by sector. Religious organizations and nonprofits often see higher numbers, while retail and travel tend to sit lower. Keep in mind that privacy protection features have made open rate less precise than it used to be.
Checking once or twice a year is usually enough, since these numbers don’t shift drastically month to month. That said, if you notice a sudden drop in your own performance, it’s worth checking current data sooner to see if it reflects a broader industry shift or something specific to your campaigns.
Most industries see average click rates between 1.5% and 2.5%. Anything above 3% is generally considered strong performance. Comparing your click rate against email marketing industry benchmarks for your specific sector gives a more accurate picture than using one overall number.
This is often caused by Apple Mail Privacy Protection, which can automatically register an email as opened even when the recipient never actually viewed it. Many marketers now treat open rate as a general signal rather than an exact measurement, and focus more on click rate and click-to-open rate instead.
Yes, region can affect performance noticeably. Generally, North America and Europe tend to show stronger open and click rates compared to some other regions, though this can shift depending on the specific industry and audience.
A healthy unsubscribe rate typically stays under 0.5%. If your rate climbs noticeably above that, it often signals issues like sending too frequently, irrelevant content, or a mismatch between what subscribers expected and what they’re actually receiving.
Not too much. Large companies often have bigger budgets, more advanced tools, and larger lists, which can skew results. Small businesses should use broad benchmark data as a general guide, but focus mainly on improving their own performance over time rather than directly comparing themselves to enterprise level brands.